Drift Timelines
Per-sheet walkthrough — L1 Reconciliation Dashboard.
What the sheet shows
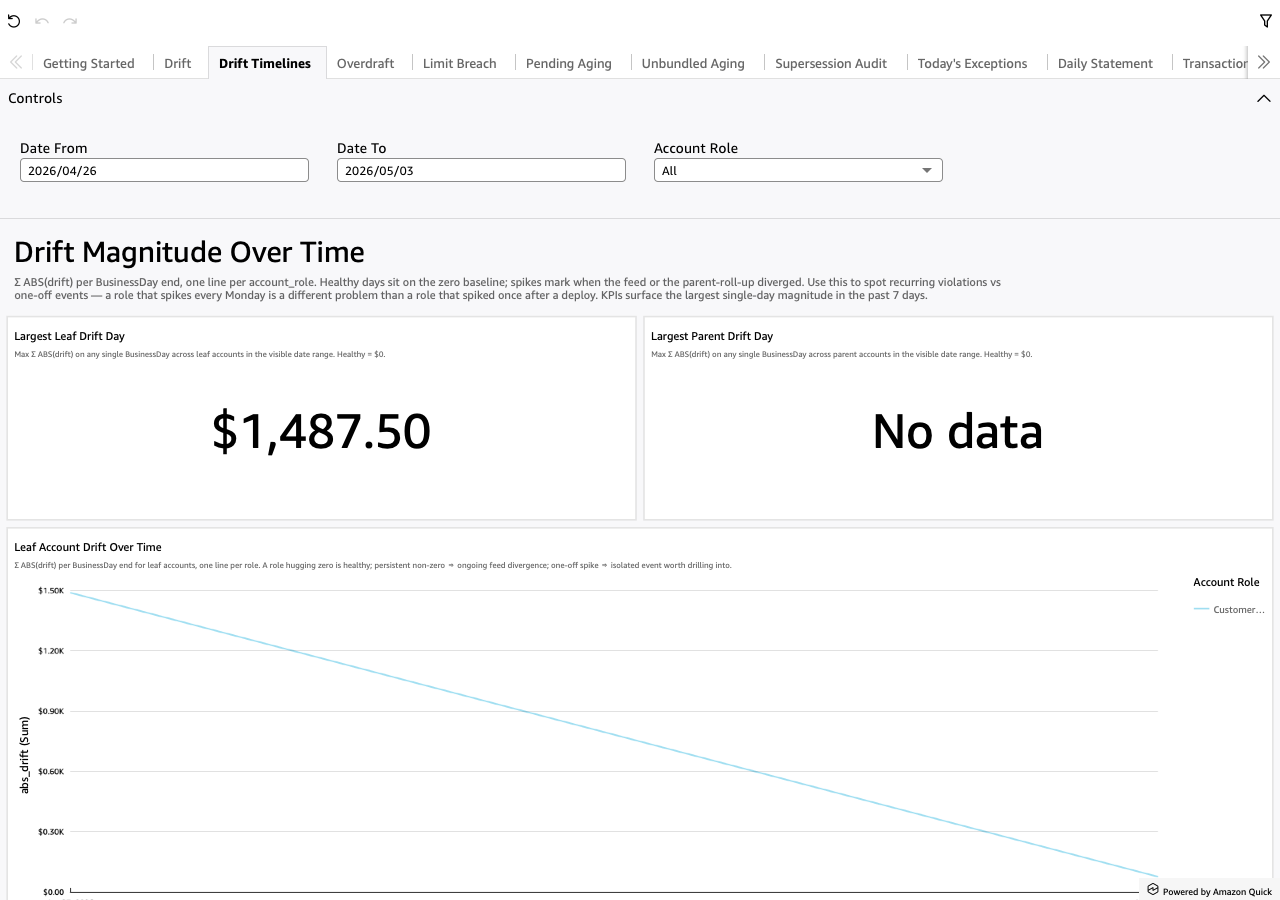
Σ ABS(drift) per BusinessDay end, broken out by account_role.
Two parallel charts:
- Leaf account drift over time — one line per leaf-account role.
- Parent account drift over time — one line per parent-account role.
Both lines hug the zero baseline on healthy days. A spike marks when the feed (leaf chart) or the parent roll-up (parent chart) diverged. A role that spikes every Monday is a DIFFERENT problem than one that spiked once after a deploy — the trend is what tells them apart.
Screenshot
When to use it
After Drift's KPI count is non-zero. Drift's detail tables answer "which rows are broken right now"; the trend timelines answer "is this a recurring pattern or a one-off". That split decides the investigation: recurring → fix the recurring cause; one-off → backfill / unblock and move on.
Visuals
- Largest Leaf Drift Day (peak business day) (KPI) —
MAX(abs_drift)over the visible date range; the worst-affected single day for any leaf role. - Largest Parent Drift Day (peak business day) (KPI) — same, parent scope.
- Leaf Account Drift Over Time (LineChart) — x-axis is
business_day_end; y-axis isSUM(abs_drift); one line peraccount_role. - Parent Account Drift Over Time (LineChart) — same shape, parent scope.
Drills
None outbound. Drift Timelines is the trend lens; drill back to Drift for per-row detail or Daily Statement for the per-account-day walk.
Filters
- Date From / Date To — universal date-range pickers.
- Account Role — narrow both lines to one role. Useful when one role's spikes are drowning out the trends in the others.